
Resilience Worcester
Helping Worcester Communities Adapt to Extreme Heat and other Climate Stresses
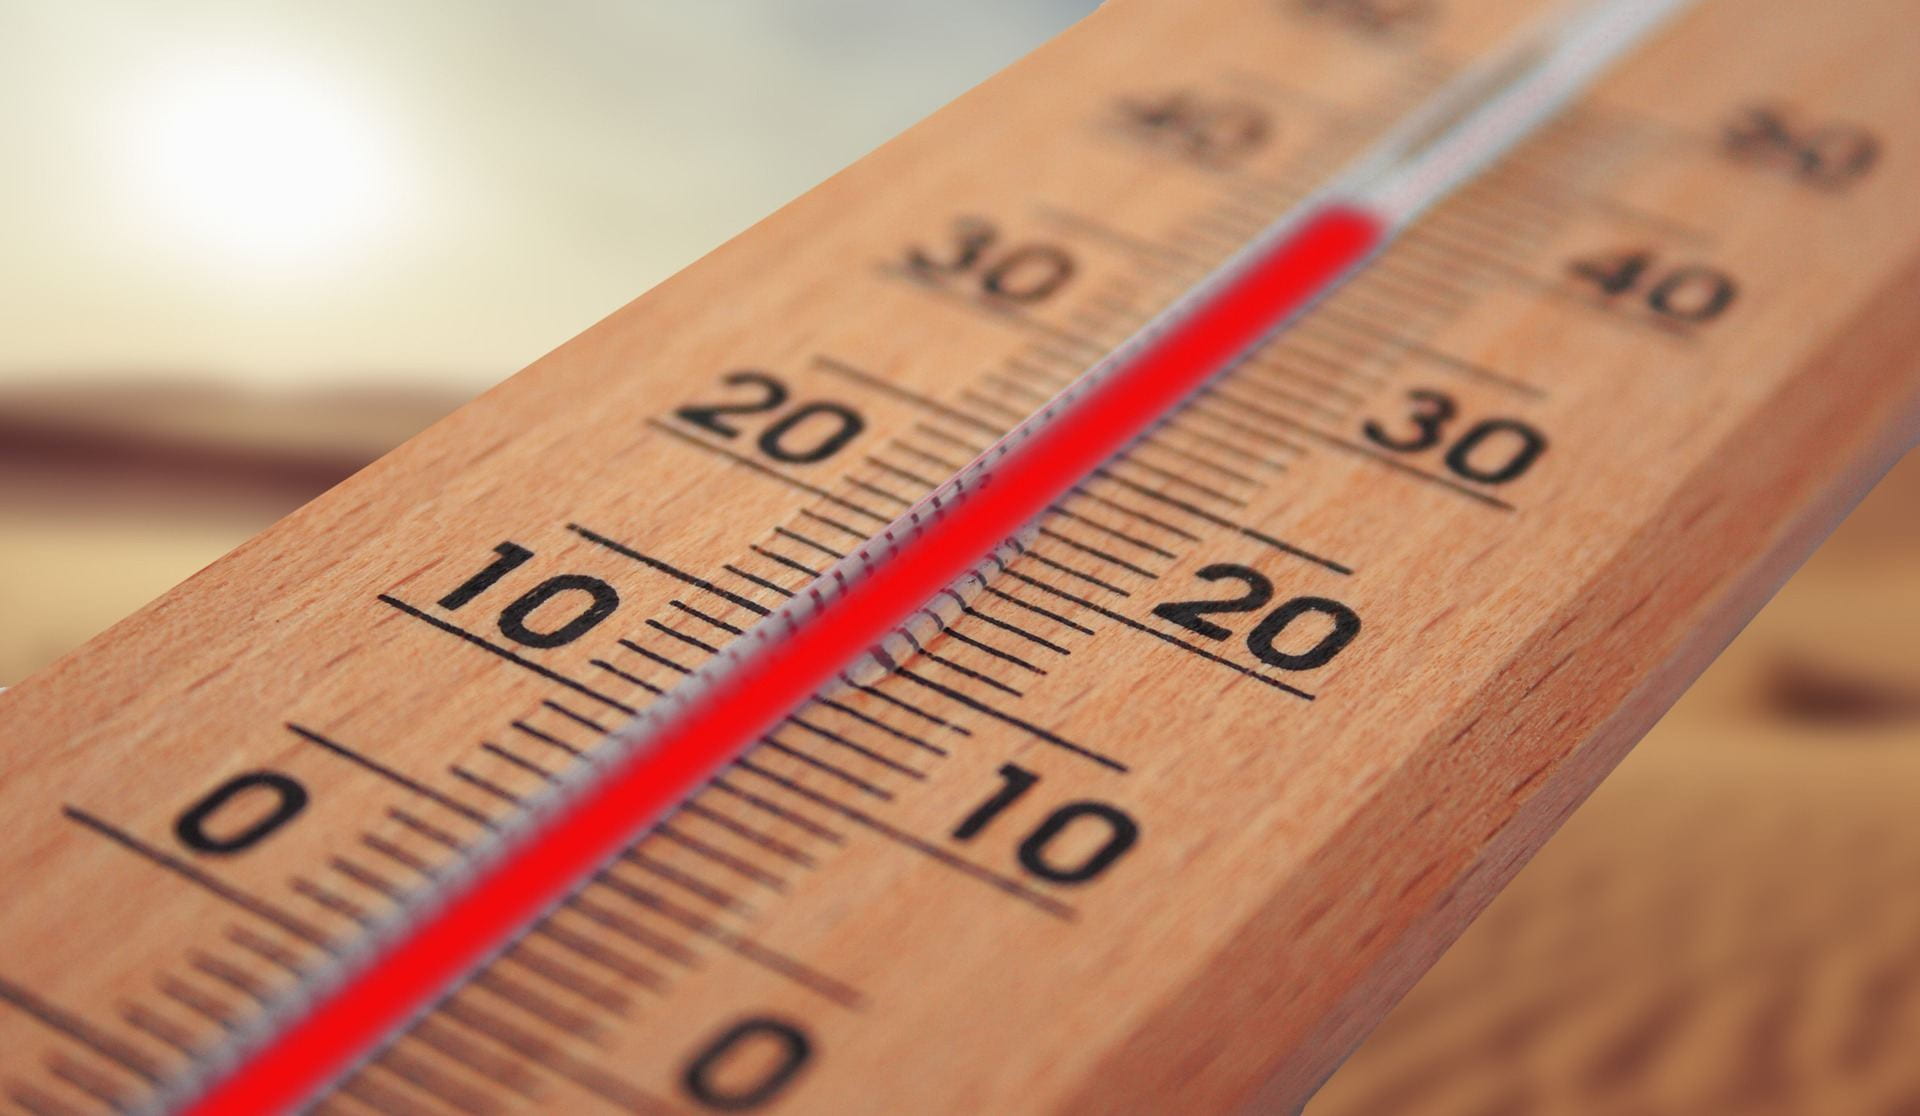
DID YOU KNOW?
Air temperatures in Worcester, particularly after sunset, can be as much as 17°F warmer than the air in neighboring towns. This is due to the Urban Heat Island effect, where structures such as buildings, roads, and other infrastructure absorb and re-emit the sun’s heat more than natural landscapes such as forests and water bodies.
Citizen Science Heat Mapping
Extreme heat waves are increasingly a concern in Worcester neighborhoods. Check out the how your town could be affected by heatwaves at different times of the day …

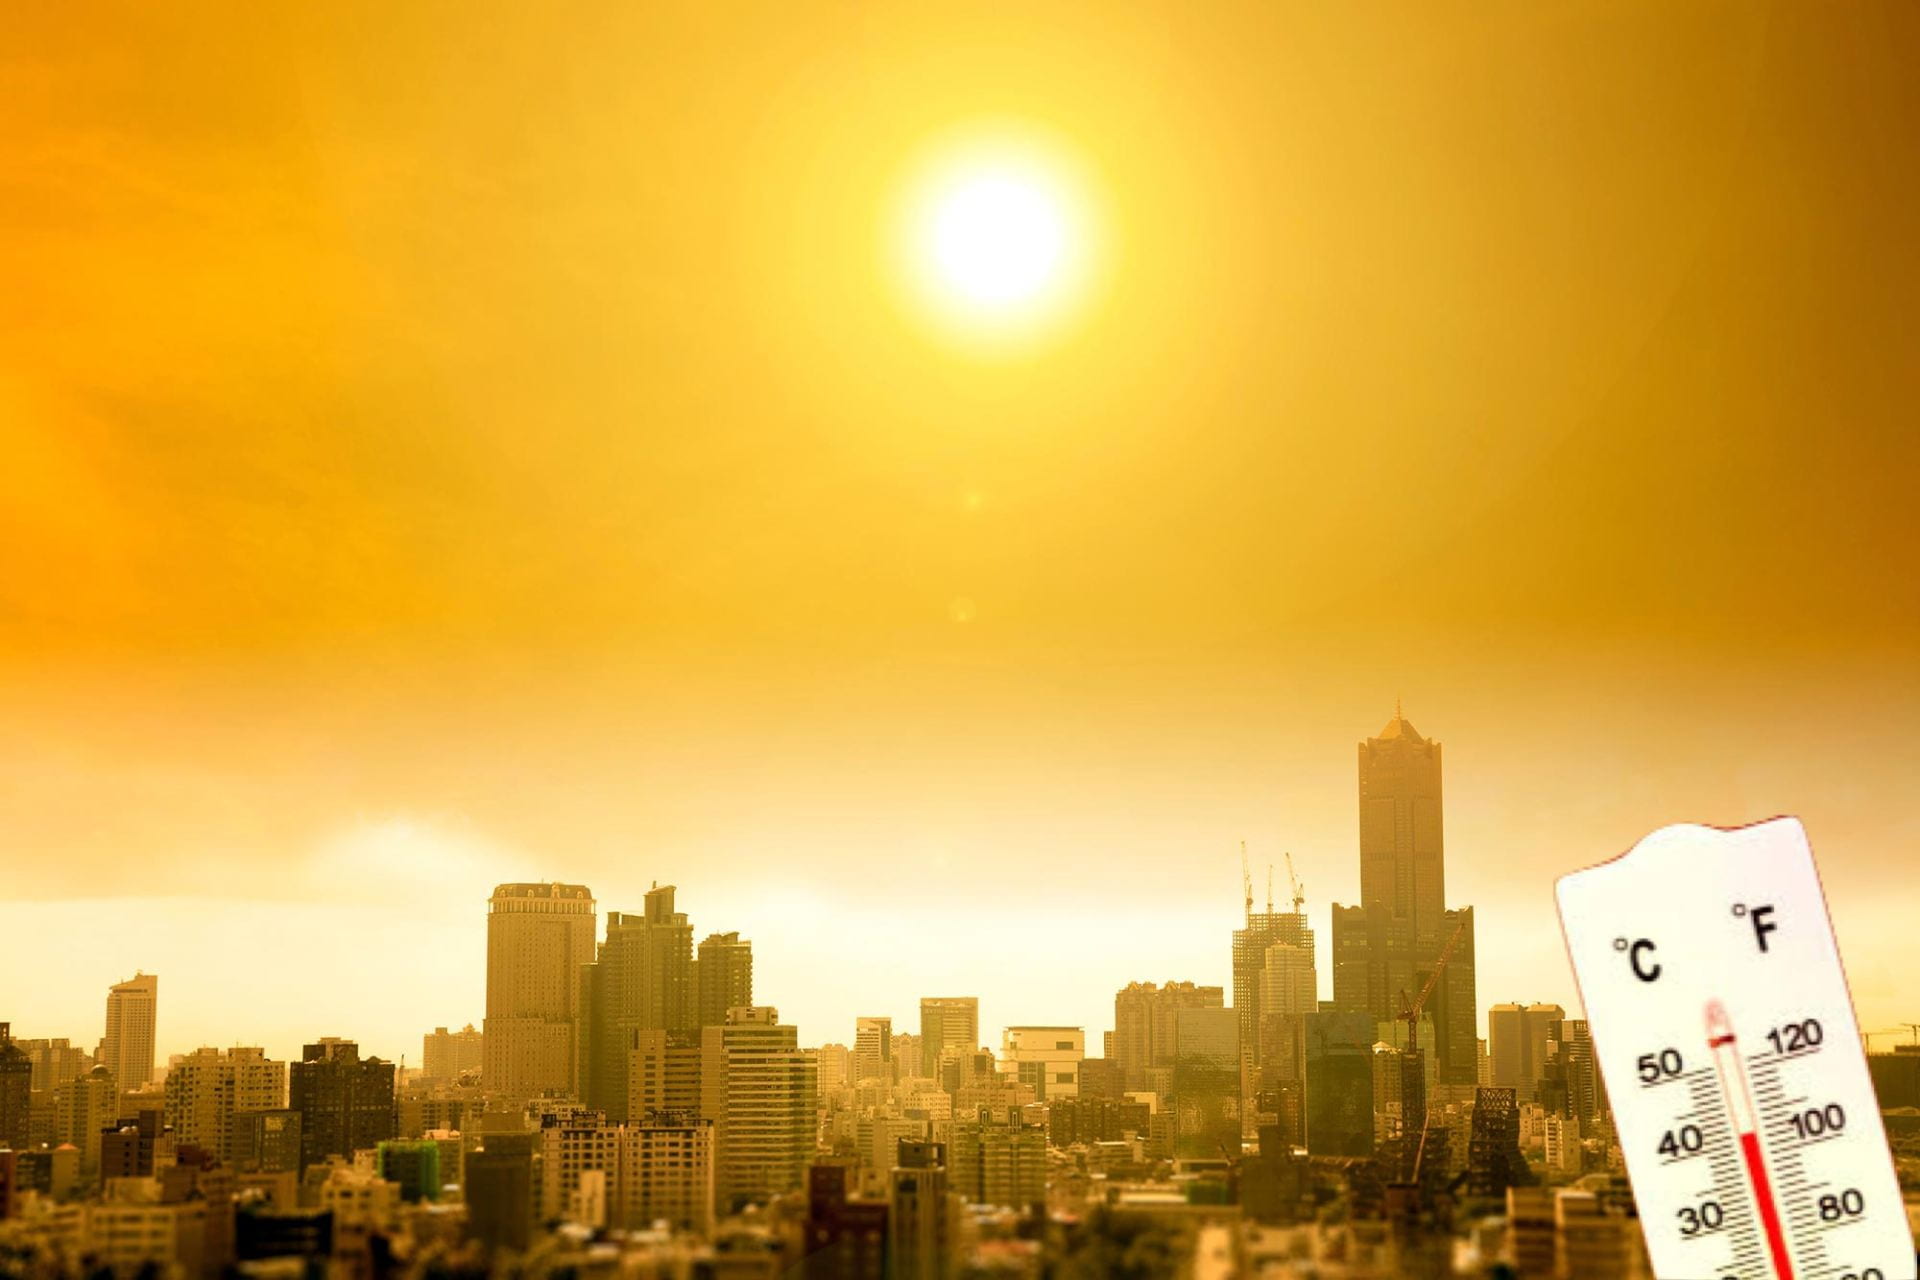
Extreme Heat & Health Impacts
Extreme heats can cause dangerous health hazards such as heat stroke or cardiovascular and respitory disorders. Learn how you can prevent these situations from occuring …
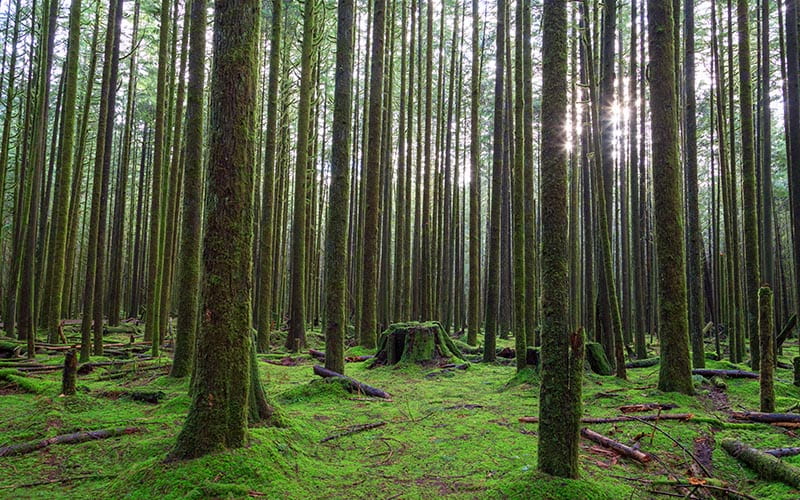
Green Infrastructure Planning
WPI is helping Worcester communities adapt to extreme heat and other climate stresses. Click the link below to learn more about the projects …
Heat Vulnerability Index for MA
Find out Massachusetts’ heat vulnerability index and understand what that means for you …
Extreme heat waves are increasingly a concern in Worcester Neighborhoods
- In fact, heat waves and extreme drought have afflicted Worcester for over 37 weeks in the last 20 years.
- Heat waves are dangerous in northern, temperate cities, where houses do not have air conditioning and effective insulation. Heating concentrates more in some areas of the city.
- Climate change is increasing both the frequency and intensity of these threats.
- Check out how heating affects your neighborhood below ↓
Worcester Heat Maps
Heat affects neighborhoods differently throughout the day based on the exchange of energy with various land cover types. Click on the interactive maps below to explore heat conditions and distributions in areas of Worcester at different times of the day.


Community scientists documented Urban Heat Islands in Worcester
- On a hot day in the summer of 2019, a group of volunteers collected temperature and humidity data across the city. Coordinated through the EcoTarium and WPI’s Global Lab, these community scientists built the foundation for understanding how heat affects Worcester.
- CAPA Strategies, Inc., a research group based at Portland State University, processed the data and generated heat maps for three times of day. Read about the heat mapping methodology below ↓ and here.
Community Science Data Collection
In 2019, 16 volunteers traversed eight study areas across Worcester, Massachusetts and collected a total of 63,407 measurements of temperature and humidity. Eight polygons were identified covering much of the city and capturing the range of land cover types in the city, and driving routes were developed for each polygon. Traverses were conducted by mounting sensor equipment on cars and driving the designated routes at 6am, 3pm, and 7pm on a hot, clear day. Sensors track GPS location, temperature, and humidity at one-second intervals through each one-hour traverse.
Modeling Methods
To model observed temperatures based on LULCs, spectral data from the Sentinel-2 satellite constellation was used. LULC attributes were described using two indices: Normalized Difference Vegetation Index (NDVI) and the Normalized Built-up Area Index (NBAI). To account for the distance-decay effect in relation to LULCs and their impacts on temperatures at a given location, each band in the analysis was transformed with a moving window average of varying spatial distances. Random Forest (RF) regression was used to build a predictive model between LULC indices and temperature.
Findings
The maximum temperature recorded was 90.9 F (in the afternoon traverse), with a highest concurrent temperature differential of 16.9 F (in the evening traverse). The models show extreme heat areas in the afternoon in a confined downtown area and following the Shrewsbury Street corridor, an area of dense commercial activity and traffic. Industrial areas heat up early in the day and release heat by evening. The urban heat island effect is most pronounced in the evening hours, with higher temperature differentials and a wide swath of the urban center retaining all of the heat.
Community forums are helping to understand how residents of Worcester experience extreme heat
The EcoTarium and the City of Worcester are hosting community forums to collect feedback from residents about how extreme heat affects them, and to generate ideas for mitigating extreme heat.
RELATED LINKS
- Worcester Municipal Vulnerability Preparedness
- CAPA Strategies
- NOAA’s National Integrated Heat Health Information Program
- EcoTarium
- Clark University, Human-Environment Regional Observatory
For more information about the Resilient Worcester Project, contact Stephen McCauley at global-lab@wpi.edu.